> ## Documentation Index
> Fetch the complete documentation index at: https://lightdash-06-24-docs-simplify-date-zoom-usage-description.mintlify.site/llms.txt
> Use this file to discover all available pages before exploring further.
# Chart types overview
> Results tables can be useful for finding specific numbers or checking out your data, but it's usually easier to see trends and make sense of your data using charts.
In Lightdash, the data in your results tables can be visualized in a bunch of different ways:
* [Bar chart](/references/chart-types/bar-chart)
* [Horizontal bar chart](/references/chart-types/horizontal-bar-chart)
* [Line chart](/references/chart-types/line-chart)
* [Area chart](/references/chart-types/area-chart)
* [Mixed chart](/references/chart-types/mixed-chart)
* [Scatter chart](/references/chart-types/scatter-chart)
* [Pie chart](/references/chart-types/pie-chart)
* [Funnel chart](/references/chart-types/funnel-chart)
* [Treemap chart](/references/chart-types/treemap-chart)
* [Sankey chart](/references/chart-types/sankey)
* [Table](/references/chart-types/table)
* [Big value](/references/chart-types/big-value)
* [Gauge](/references/chart-types/gauge)
* [Map](/references/chart-types/map)
* [Custom chart](/references/chart-types/custom-charts)
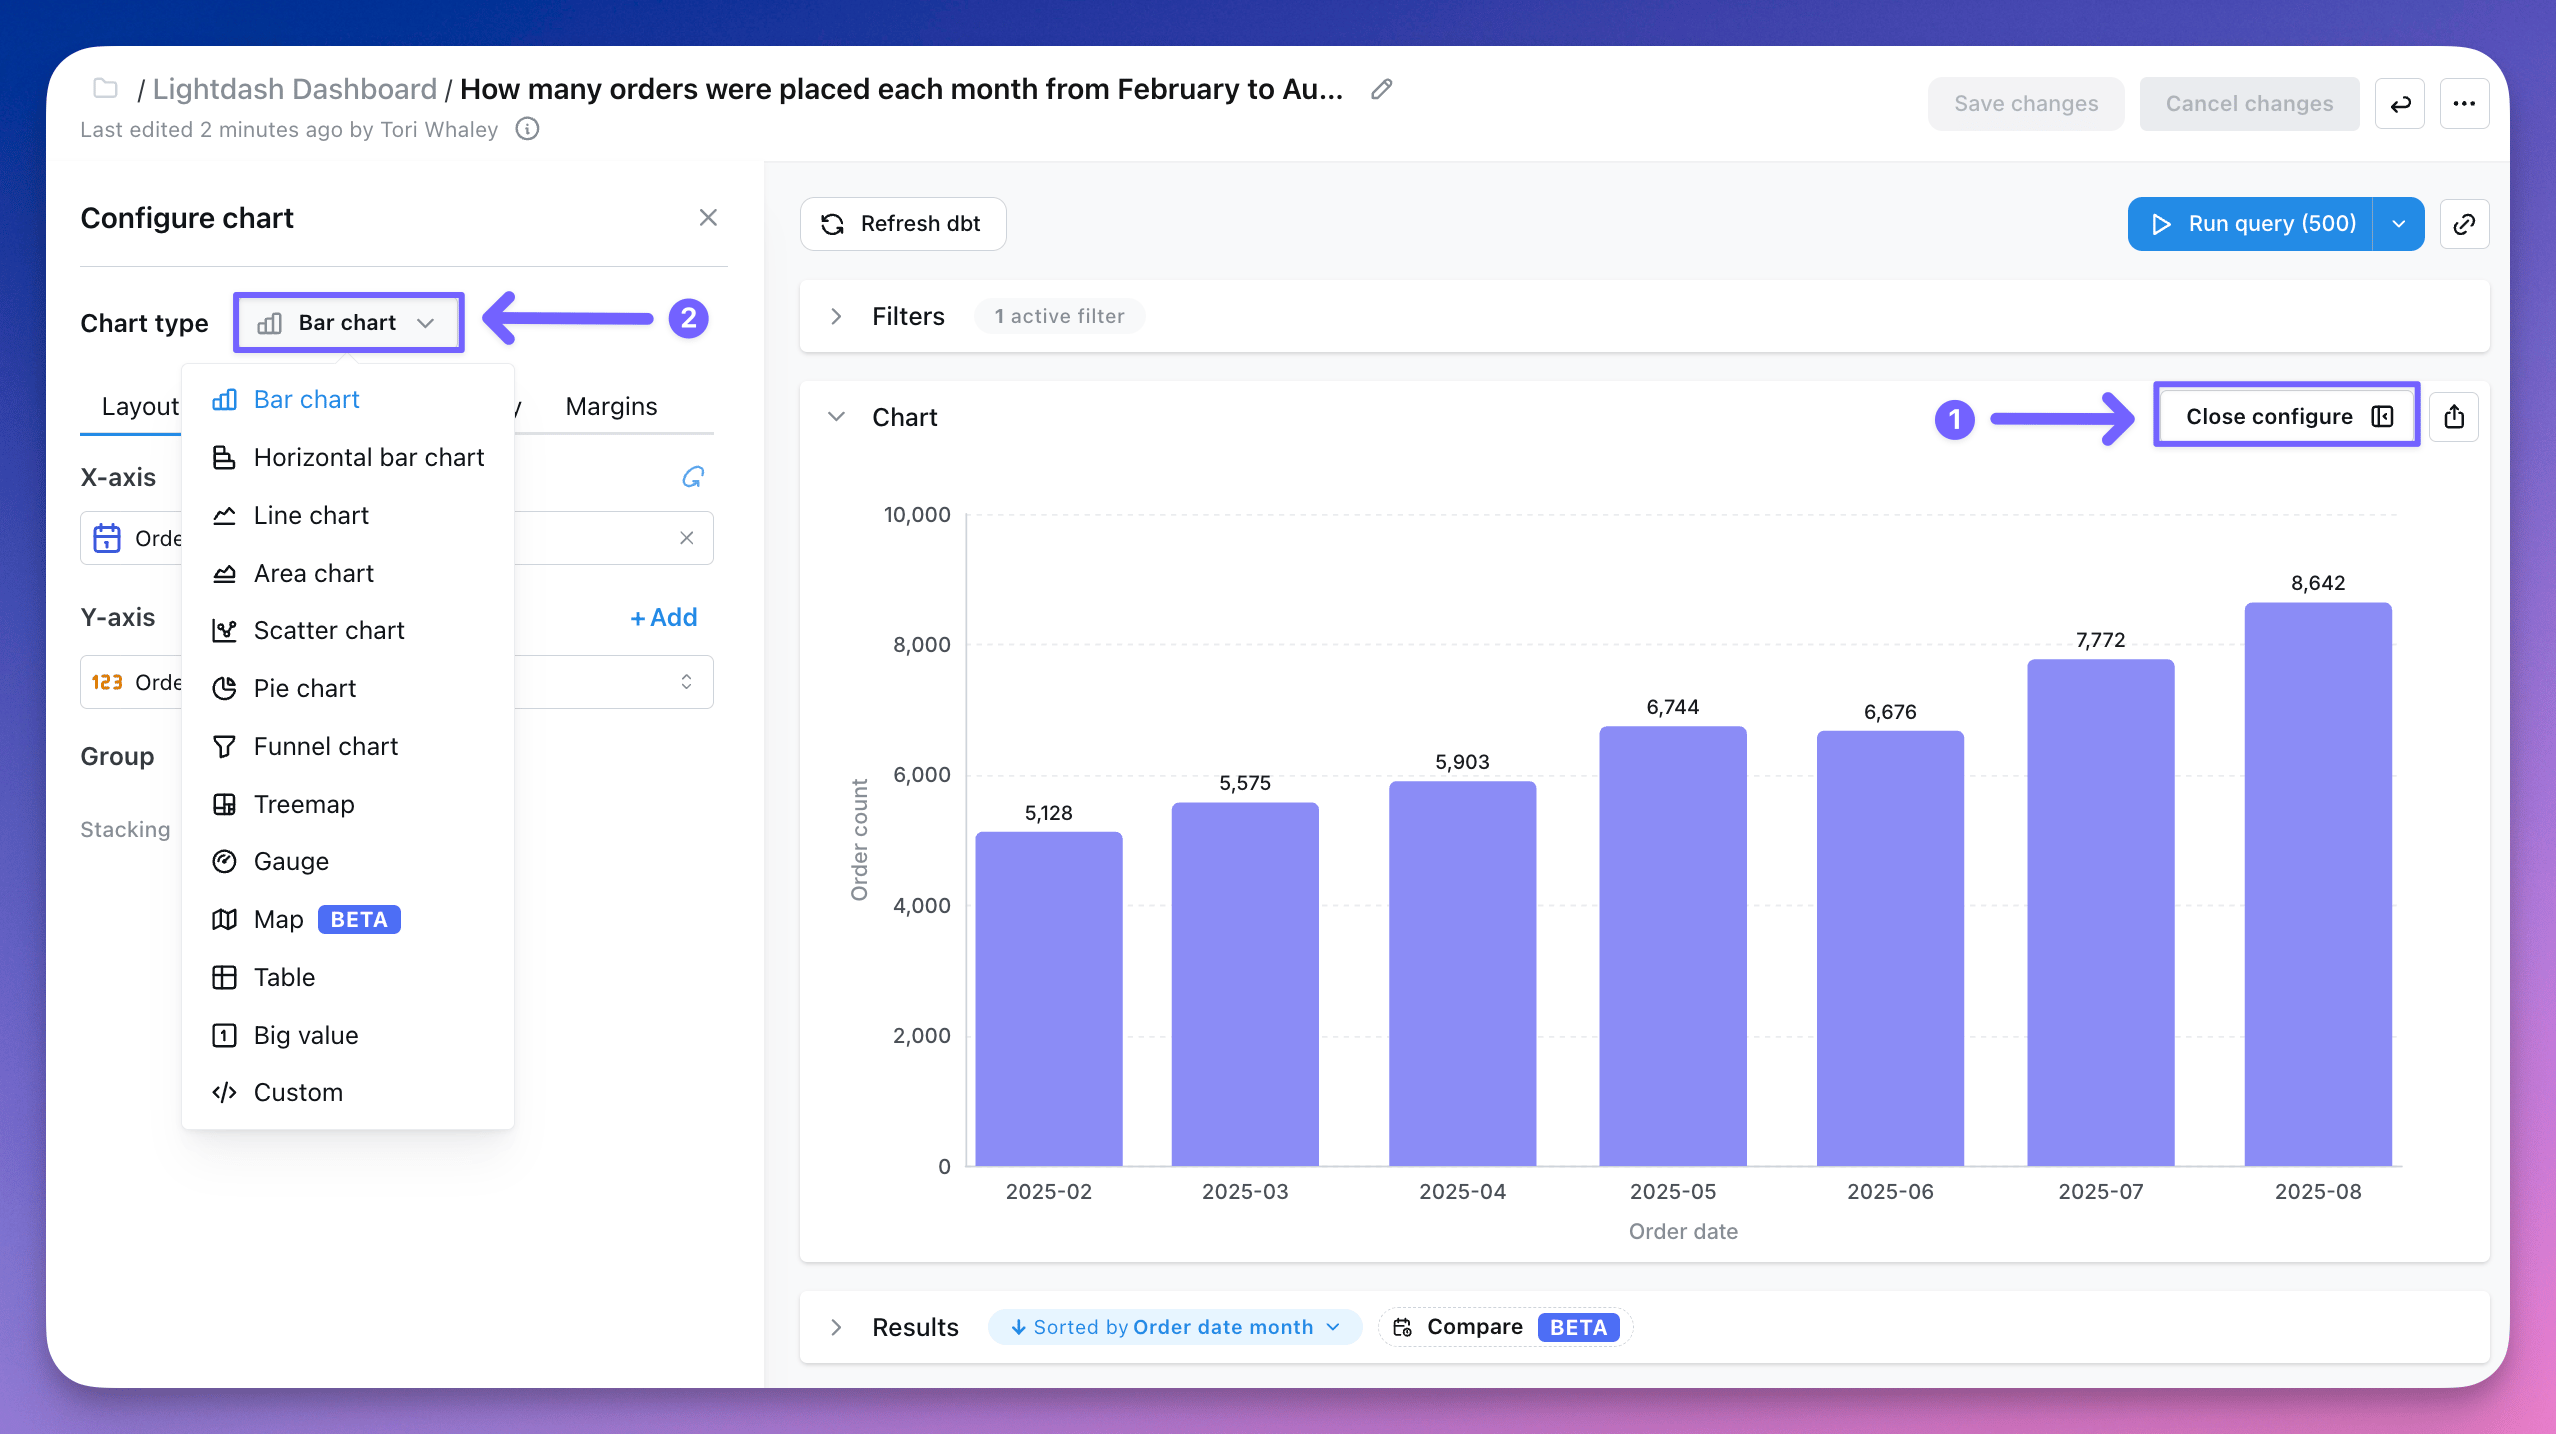
The visualization type that you pick determines how Lightdash shows the data series in your chart. To change how your data is displayed, click **Configure** when you're querying from a table. You have the option to change the chart type in the drop-down: